HelloELK is a repository which provides hands on introduction to Elastic Stack(formerly ELK Stack) using simple configuration file.
Here, we will be creating a simple pipeline where inputs will be provided from STDIN by user and will be shown in Kibana.

Elastic Stack requires Java 8 or above. Make sure you have one in place by executing following command in CMD.
java -versionyou should get following output
java version "1.8.0_121"
Java(TM) SE Runtime Environment (build 1.8.0_121-b13)
Java HotSpot(TM) 64-Bit Server VM (build 25.121-b13, mixed mode)
If Java is not installed or configured properly, please follow steps mentioned here.
Head over to Elastic's downloads section and download ElasticSearch, Logstash and Kibana. For reference, following versions are used here for windows environment:
Unzip the packages and we're good to go.
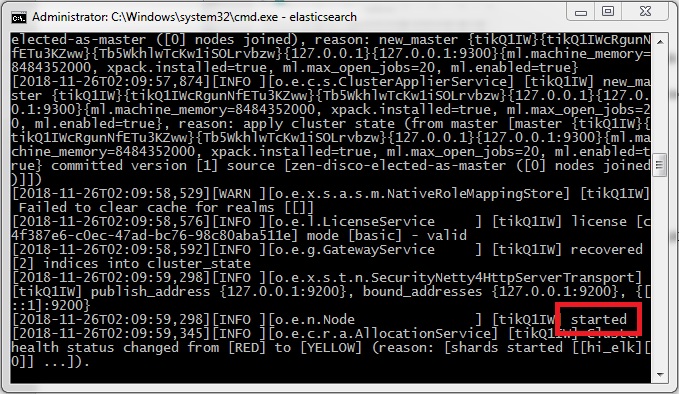
- Open command prompt in "\elasticsearch-6.5.1\bin" and execute command:
elasticsearch-
After getting "started" message, we can proceed to next step.
-
Head over to localhost:9200. You should get reponse similar to following :
{
  "name" : "udlVS2N",
  "cluster_name" : "elasticsearch",
  "cluster_uuid" : "64onb1QsRy-CZKLT5B9-rw",
  "version" : {
    "number" : "6.5.1",
    "build_flavor" : "default",
    "build_type" : "zip",
    "build_hash" : "8c58350",
    "build_date" : "2018-11-16T02:22:42.182257Z",
    "build_snapshot" : false,
    "lucene_version" : "7.5.0",
    "minimum_wire_compatibility_version" : "5.6.0",
    "minimum_index_compatibility_version" : "5.0.0"
  },
  "tagline" : "You Know, for Search"
}-
Create a file named logstash.conf inside directory "\logstash-6.5.1". This is logstash configuration file which contains "input", "filter" and "output" plugins. Input plugin is used by logstash to read data from the source specified, which in our case is, STDIN. Filter plugin is used to filter out irrelevant data and massage the incoming data into JSON objects. We have used GROK filter to achieve this. Output plugin is used to send data extracted from input using filter to provided destination, which in our case is ElasticSearch.
-
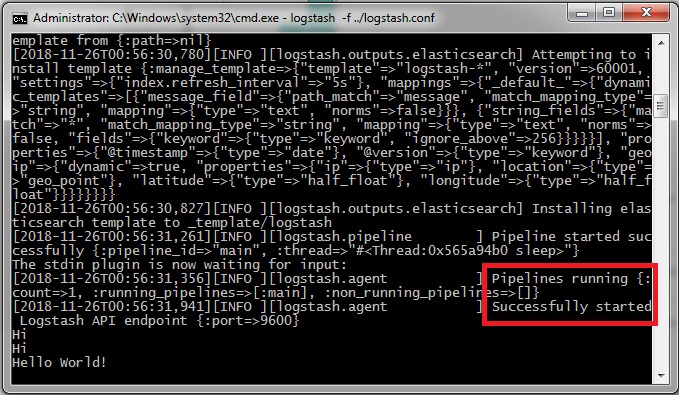
Open command prompt in "\logstash-6.5.1\bin" directory and execute command:
logstash -f ../logstash.confThis will start the logstash pipeline INPUT(STDIN) -> FILTER(GROK) -> OUTPUT(ElasticSearch).
- After getting "pipelines running" or "Successfully started API Endpoint" message, we can proceed to next step. Hereafter, this window will be referred as "Logstash Console". Write any message here and hit Enter. Get ready to see your message in Kibana!
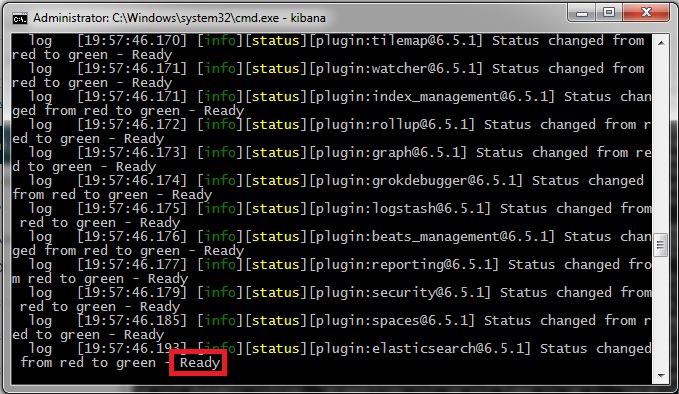
- Open command prompt in “\kibana-6.5.1-windows-x86_64\bin” and execute command:
kibana- After getting "Ready" message, we can proceed to next step.
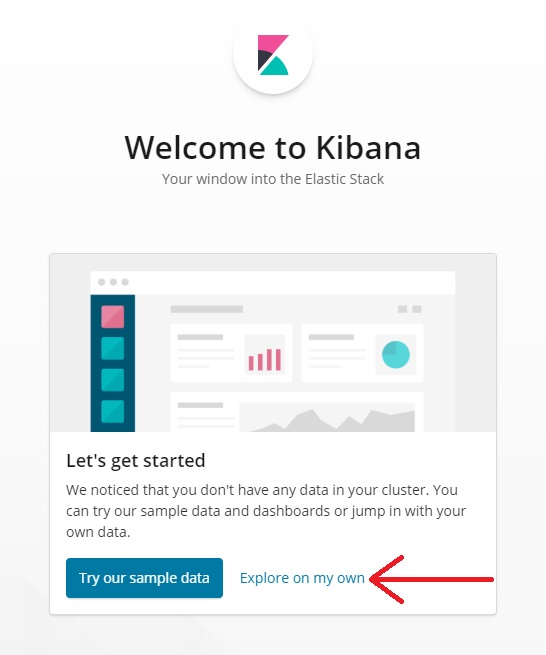
- Open localhost:5601 in browser.
- If Kibana Welcome Screen shows up, select "Explore on my own".
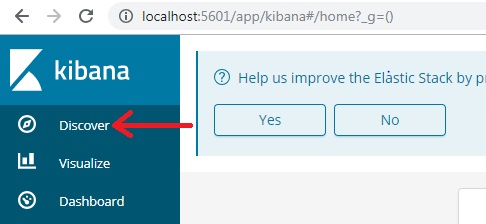
- Head over to "Discover".
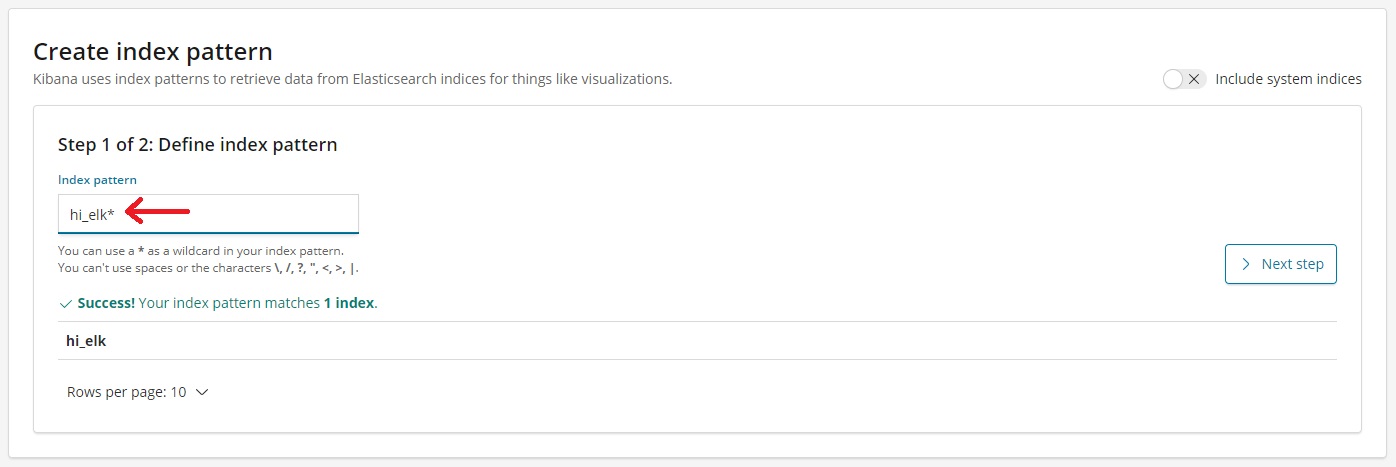
- You will be asked to create a "Index Pattern". Enter "Index Name" (which we created in logstash.conf file) and hit "Next Step".
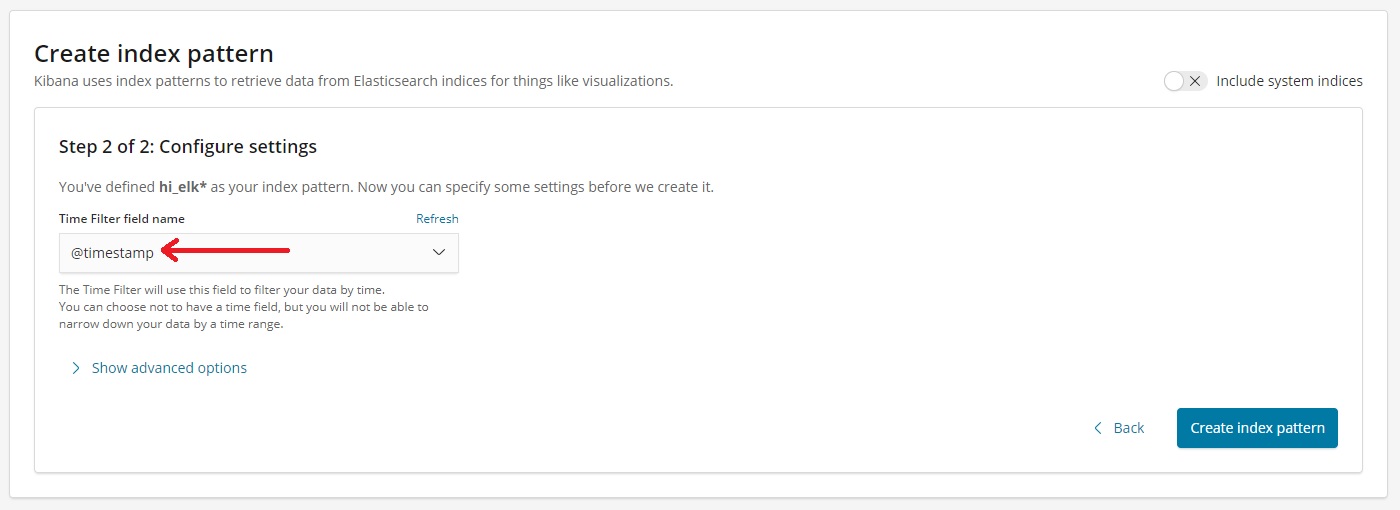
- Select Timestamp from dropdown and hit "Create index pattern".
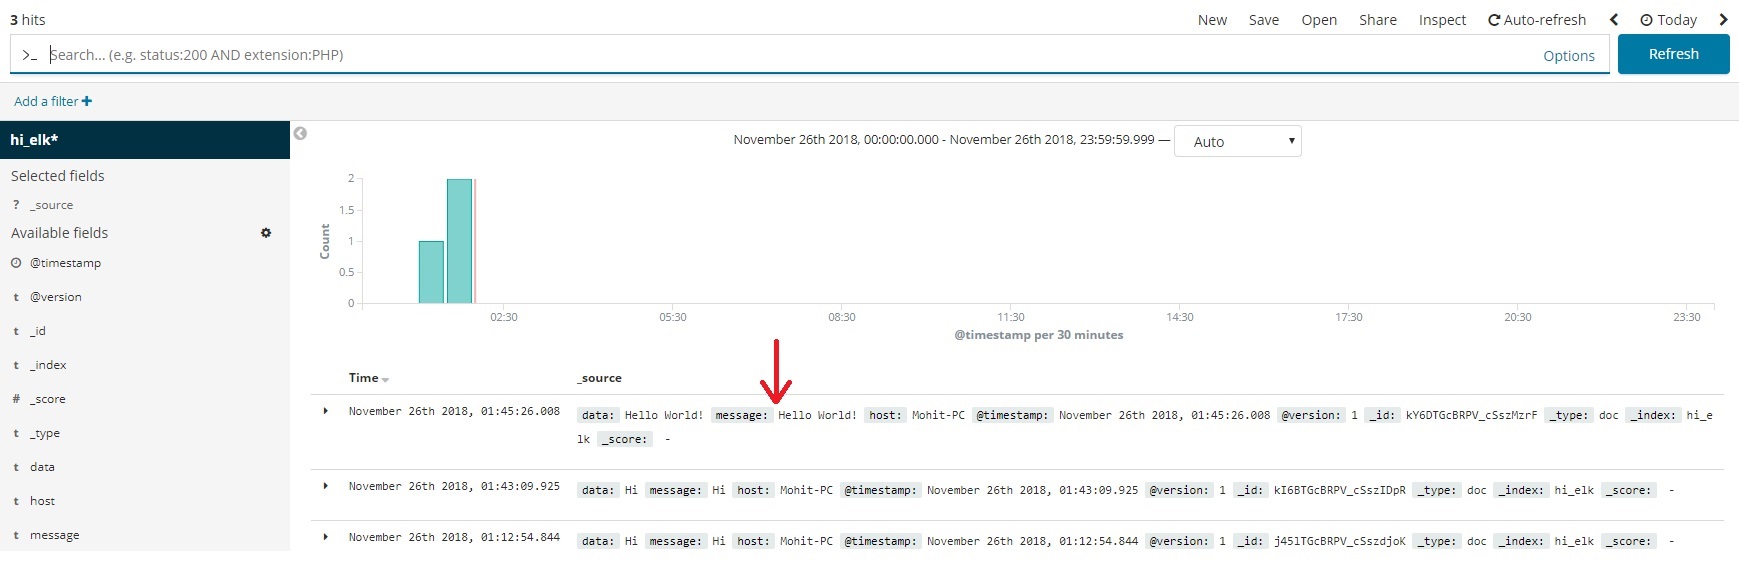
- You will be shown Index Pattern Screen. Head over back to "Discover" Section (Step 5) and Select "Today" in the Time Range:
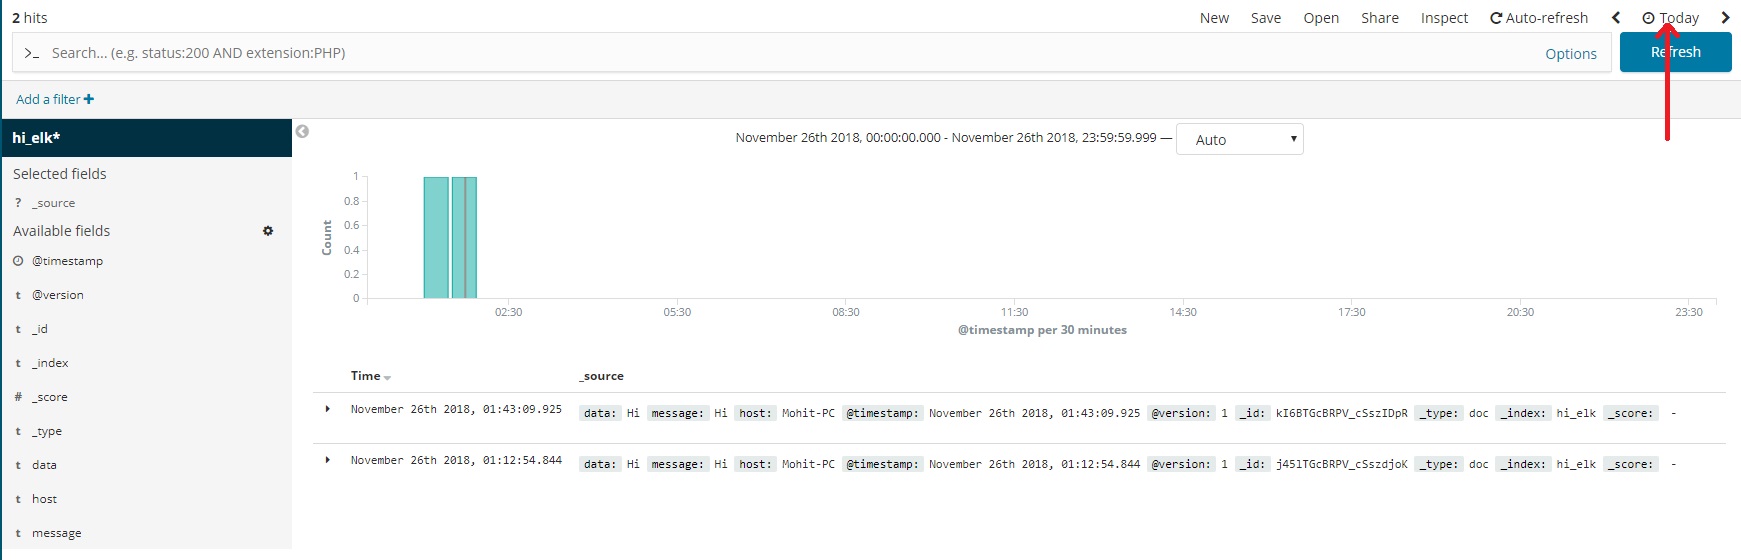
- You can see your messages (Sent from Logstash in Step 3 of Logstash setup) in Kibana now.
- To play along, enter new messages in Logstash Console, Head over back to Kibana and hit Refresh. Your messages will show up in Kibana.
We are now done with ELK Stack Hello World! We have successfully setup up ELK and created Logstash pipeline.
For Kibana visualizations and Dashboards, read here.
For advanced pipelines, read here.
Read more about Logstash filters here.
Read more about GROK filter here.
For Java based GROK filters, refer this. It will come handy while parsing LOGs for APM (Application Performance Monitoring).
For more GROK filters, refer this.